A big part of a trader’s success is the ability to technically analyze assets. In this article, you’ll learn what technical analysis is and how you can use it to identify new trading opportunities.
Types Of Stock Analysis
There are three major types of stock analysis:
- Fundamental analysis
- Technical analysis
- Sentimental analysis.
1. Fundamental analysis seeks to determine whether a company’s future share price is accurately reflected in its current share price by looking at a company’s business, its industry and the economy as a whole. Fundamental analysis is typically used to assess long-term investments and it considers:
- Earnings per share (EPS)
- Price-to-earnings (PE) ratio, which is a company’s share price divided by its annual per-share earnings and is used to compare companies within the same sector
- Price-to-earnings-growth (PEG) ratio is the PE ratio divided by the future annualized earnings growth rate
- Price-to-book (P/B) ratio where a company’s stock price is divided by its book value, where book value equals the net value of all the company’s assets; the P/B ratio is used to compare a company with its competitors
- Debt-to-Ebitda ratio: A company’s total debt appear on its balance sheet and its Ebitda (earnings before interest, taxes, depreciation and amortization) appears on a company’s income statement; if the ratio found by dividing debt by Ebitda is high that can be a sign of higher risk.
Publicly traded companies are required to report their earnings quarterly to the Securities and Exchange Commission (SEC) on what’s known as a Form 10-Q. Companies must also file an annual report of their earnings on a Form 10-K. You can find both types of filings on the SEC’s EDGAR database.
Share price can be affected by external factors such as the federal funds rate, crude oil prices, market growth or recessionary cycles, jobs numbers, the rate of inflation and consumer confidence numbers. Every month, the U.S. government publishes data on employment, inflation and consumer sentiment.
2. Sentiment analysis looks at the attitudes of investors toward a company and often it assumes that if the current sentiment is in one direction, then the opposite direction is the way to go. Because of that, sentiment investors are often referred to as contrarians.
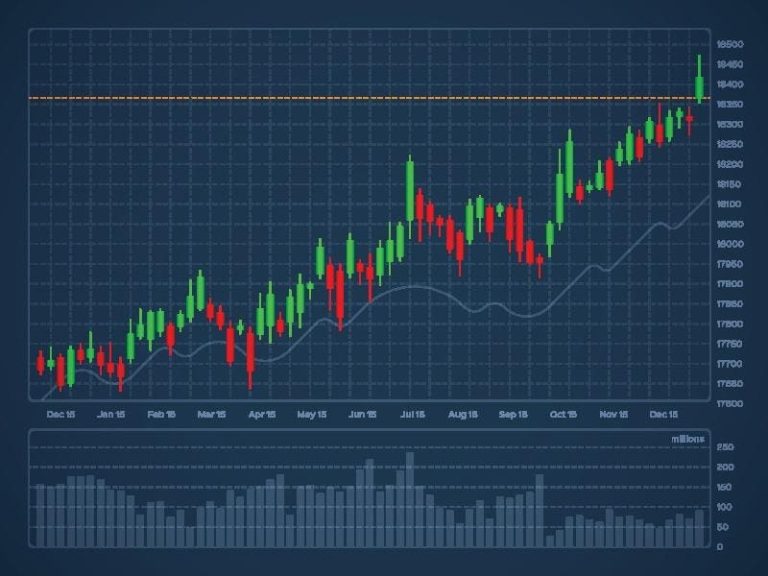
3. Technical analysis assumes that all the information required to assess a company is already reflected in that company’s current share price and that share prices move in both identifiable and consistent ways. Technical analysis is primarily used to assess short-term investments, with analysts using candlestick charts, also known as Japanese candlestick charts, to identify the following information:
- Levels, which indicate whether prices will continue to move in a given direction or else reverse direction
- Buying and selling opportunities, which are also known as entry and exit points
- Market sentiment
Two major types of technical analysis are reading chart patterns and statistical indicators. With the latter, technical analysts use mathematical formulas on prices and volumes to create moving averages that smooth out price data and make it easier to spot trends. Technical analysts also look at moving average convergence divergence (MACD).
Chart patterns can be used to predict the direction of prices, areas of support or resistance and price breakout and breakdown points. While line charts and bar charts are sometimes used, most technical analysts use candlestick charts.
Mispriced stocks are hiding in plain sight and present great investment opportunities for the remainder of 2023. Forbes’ top investment experts share 7 overlooked stocks in this exclusive report, 7 Best Stocks To Buy For The Second Half of 2023. Click here to download it now.
Reading Candlestick Charts
Besides charting stocks, candlestick charts are also used to chart derivatives, futures, commodities and currencies. Hedge funds use candlestick chart patterns to create the algorithms on which they rely to make lightning-fast trading decisions. While an individual investor might not be able to read a candlestick pattern and execute a trade as fast as a hedge fund can, knowing how to interpret candlestick patterns can give retail investors a distinct leg up on the competition.
On candlestick charts, such as the one shown at the top of this article, the horizontal axis reflects time, and the vertical axis reflects price. At the bottom of a candlestick chart is usually a bar chart displaying trading volumes.
Each candlestick “forms” over the course of a specific time period, which for stocks is one day. For currencies, a candlestick can form in as little as 15 minutes. Candlesticks are either colored white/green, which means that the stock’s closing price was higher than its opening price, or they are colored black/red, which means that the stock’s closing price was lower than its opening price.
Each candlestick displays four price points:
- Opening price
- Closing price
- Highest price
- Lowest price.
The wide part of a candlestick is known as its real body. For green/white candlesticks, which we’ll refer to as “up” candlesticks, the top of the real body lines up with the stock’s closing price and the bottom of the real body lines up with the stock’s opening price.
For black/red candlesticks, which we’ll refer to as “down” candlesticks, the top of the real body lines up with the stock’s opening price and the bottom of the real body lines up with the stock’s closing price.
Candlesticks usually have thin lines extending from both the top and bottom of the real body. These are referred to as wicks or shadows, and the top of the top wick lines up with the highest price the stock achieved during the course of one day. The bottom of the bottom wick lines up with the lowest price the stock achieved during that day.
If a candlestick has a long real body, that means that there was a large difference between its opening and closing prices. If a candlestick has a short real body, that indicates that there was only a small difference between the stock’s opening and closing prices.
If a candlestick doesn’t have either a top or a bottom wick, that means that its opening or closing price was identical to either the highest price or the lowest price during the day.
A candlestick having longer wicks means that the stock experienced greater price volatility during that day. To know a stock’s price range over the course of a day, all an investor has to do is subtract the lowest price from the highest price.
Mispriced stocks are hiding in plain sight and present great investment opportunities for the remainder of 2023. Forbes’ top investment experts share 7 overlooked stocks in this exclusive report, 7 Best Stocks To Buy For The Second Half of 2023. Click here to download it now.
Candlestick Patterns
Patterns formed by the candlesticks forecast the supply, demand and price direction of stocks, derivatives, commodities or currencies. In general:
- A series of up candlesticks indicates an upward price trend or a bullish market
- A series of down candlesticks indicates a lower price trend or a bearish market
- A short real body but long wicks indicates a large price range but little difference between the opening and closing prices; this signals weakness in an ongoing trend
- An up candlestick having no wicks means that the stock opened at its low and closed at its high, and for a down candlestick, it means that the stock opened at its high and closed at its low which signals the continuation of a trend.
There are lots of candlestick patterns with some having such exotic names as Gravestone Doji or Dragonfly Doji. Below are some of the more well-known candlestick patterns and what they mean:
Finding Stock Charting Apps
While stock charting is included on most broker’s sites, there are standalone charting apps that provide candlestick charts plus a whole lot more. The best of these are:
- TradingView: Offers 14 chart types, more than 20 timeframes as well as drawing tools and built-in indicators. A unique feature is TradingView’s ability to chart data from income statements and balance sheets that melds a stock’s fundamentals with its price movements. There are several price tiers ranging from free to $59.95 a month.
- TradeStation: You’ll have to sign up for an account to take advantage of TradeStation’s charting, chart analysis, watchlists and brokerage services. However, with no account minimum, you can essentially use the app’s advanced charting features for free.
- StockCharts: Lacks some of the functionality of other apps with another drawback being that its charts aren’t dynamic in real time, but rather are on a 5- to 15-second delay. This makes StockCharts less useful for day traders. StockCharts offers a free one-month trial; its Basic tier is $14.95 per month and its Extra and Pro levels are $24.95 and $39.95, respectively.
- Benzinga Pro: While including full TradingView chart integration, Benzinga’s unique benefits lie in its active newswire and its BZ Signals feed, which delivers price spike information, option activity, block trade activity and circuit breaker information. Pricing tiers include a free trial with the Basic tier starting at $27 per month.
- Finviz: This is our top choice for a charting app because of finviz’s free, high-quality candlestick charts, technical indicators and heat maps. You can upgrade to FinvizElite, which includes real-time quotes, intraday charts and advanced charting tools, all for a reasonable $24.96 per month.
Whichever charting app you choose, being able to perform a technical analysis can add value to your portfolio because it uniquely provides insight on the timing of both purchases and sales.
Mispriced stocks are hiding in plain sight and present great investment opportunities for the remainder of 2023. Forbes’ top investment experts share 7 overlooked stocks in this exclusive report, 7 Best Stocks To Buy For The Second Half of 2023. Click here to download it now.
Read the full article here


